What is the real estate market like in Missouri City, Texas?
What is the real estate market like in Missouri City, Texas?
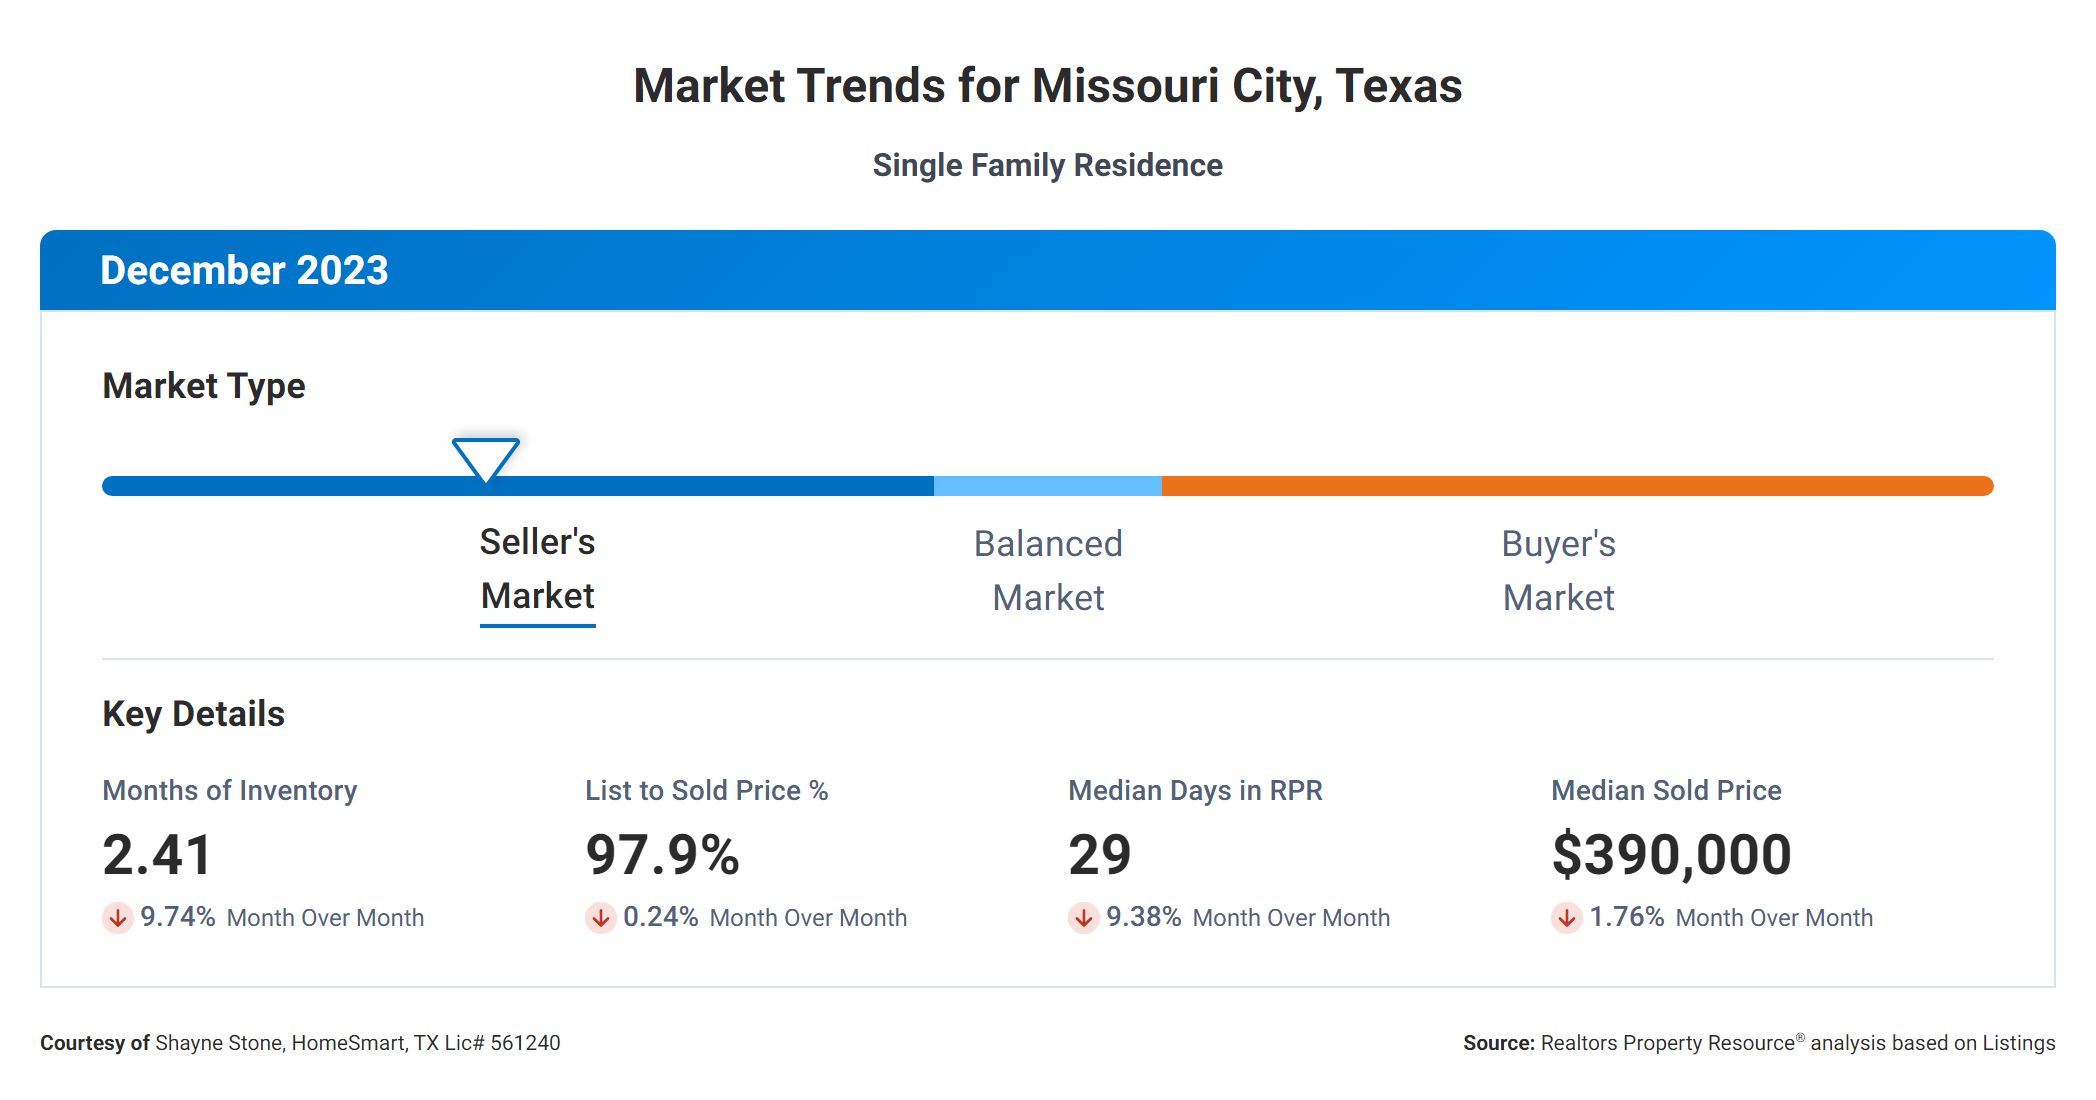
December 2023
In the real estate market, there are several key metrics that are essential for both buyers and sellers to understand. These metrics provide valuable insights into the current state of the market and can help guide decision-making. Let's take a closer look at the correlation between these metrics and what they mean for buyers and sellers.
First, let's examine the Months Supply of Inventory, which currently stands at 2.41. This metric represents the number of months it would take to sell the existing inventory of homes on the market, given the current sales pace. A lower number indicates a seller's market, where demand exceeds supply, while a higher number suggests a buyer's market, where supply outpaces demand.

Next, we have the 12-Month Change in Months of Inventory, which shows an increase of 16.99%. This indicates that the supply of homes on the market has grown over the past year. While this may suggest a shift towards a buyer's market, it's important to consider other factors as well.
The Median Days Homes are On the Market is 29, indicating that homes are selling relatively quickly. This is good news for both buyers and sellers, as it suggests a healthy level of market activity. Buyers can expect to find a variety of options to choose from, while sellers can anticipate a reasonable timeframe for selling their property.
Moving on to the List to Sold Price Percentage, we see a figure of 97.9%. This metric represents the average percentage of the listing price that homes are actually selling for. A higher percentage indicates that homes are selling close to or above their listing price, which is favorable for sellers. However, buyers should take note of this as it suggests that they may need to be prepared to negotiate and potentially pay close to the listing price.
Lastly, we have the Median Sold Price, which currently stands at $390,000. This metric represents the midpoint of all the sold prices in the market. It provides an indication of the overall price range and can be used as a benchmark for both buyers and sellers. Sellers can use this figure to price their homes competitively, while buyers can use it to gauge the affordability of properties in the market.
Overall, these metrics provide a comprehensive view of the real estate market. The Months Supply of Inventory and the 12-Month Change in Months of Inventory give insights into the supply and demand dynamics. The Median Days Homes are On the Market and the List to Sold Price Percentage provide information on market activity and pricing trends. Finally, the Median Sold Price offers a snapshot of the price range in the market. By understanding these metrics, both buyers and sellers can make more informed decisions and navigate the real estate market with confidence.
For a more detail Real Estate Market Report for Missouri City and/or other reports for Ft Bend County or YOU want to learn theMarket Valueof YOUR HOME -CLICK HERE!!!