Sign In
Create an account and enjoy all the benefits of HAR.com!
Sign In
Sign in using social account


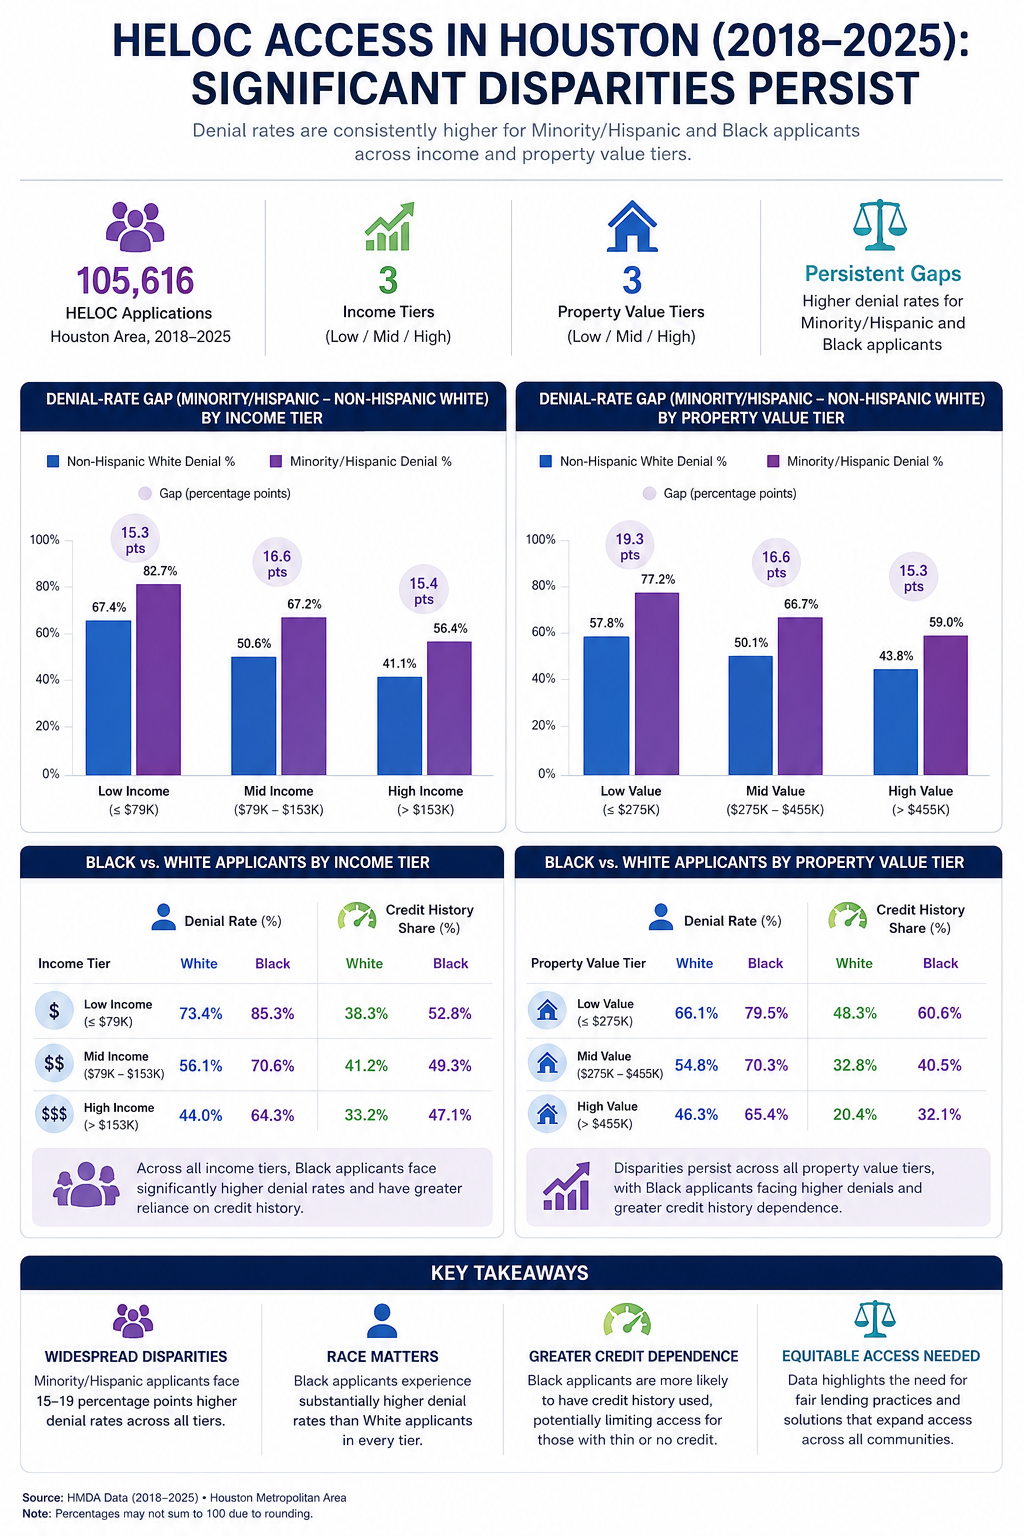
If you're a Houston homeowner thinking about tapping your equity — through a HELOC, a cash-out refinance, or any second-lien product — the data on how these applications actually get decided is public. It's called HMDA data (the Home Mortgage Disclosure Act), and every lender making these loans has to report it to federal regulators every year. At Luxintel Property, we pull this dataset regularly to understand the Houston lending market, and this time we looked at something worth sharing directly with buyers and homeowners: how HELOC denial rates and denial reasons differ by race and ethnicity, and whether that gap holds up once you control for income and property value.
A note on what this data can and can't tell you, up front: HMDA data does not include credit scores. It includes the reason code a lender selects when denying an application — "Debt-to-Income Ratio," "Credit History," "Collateral," and so on — but not the underlying number. So what follows is a look at reported outcomes and reasons, not a claim about any individual lender's decision-making or any individual borrower's creditworthiness. With that caveat clearly stated, here's what eight years of Houston-area data (2018–2025, roughly 105,000 HELOC applications across Harris, Fort Bend, Montgomery, Brazoria, Galveston, and the surrounding counties) shows.
Comparing non-Hispanic White applicants to Minority and Hispanic applicants as a group, the denial-rate gap has held in a fairly narrow band every single year since 2018 — between roughly 16 and 22 percentage points. The good news: it has been trending down. The gap was widest in 2021 (22.6 points) and has narrowed each year since, down to about 16.5 points in 2024 and 2025. That's still a meaningful gap, but the direction is the right one.
This was the most important thing we tested. It's reasonable to wonder whether a denial-rate gap like this mostly reflects income or home-value differences between groups, rather than anything happening at the application level. So we split Houston applicants into three income tiers and three property-value tiers (low, mid, high, based on the actual distribution of Houston applicants) and re-ran the comparison within each tier.
The gap did not meaningfully shrink. Comparing non-Hispanic White and Minority/Hispanic applicants within the same income tier, the gap ranged from 15.3 to 16.6 percentage points — essentially flat across low, mid, and high income. Within the same property-value tier, it ranged from 15.3 to 19.3 points. In other words, a Minority or Hispanic applicant in the top income tier still denied at a meaningfully higher rate than a non-Hispanic White applicant in that same top tier.
Beyond the overall rate, we looked at why applications get denied, broken down by race. Across nearly every group, "Debt-to-Income Ratio" is the single most common denial reason. Black applicants are the exception: for this group, "Credit History" is the leading denial reason (just over half of all denials), ahead of Debt-to-Income Ratio.
We tested whether this pattern was just an income effect too — and it wasn't. Even in the highest income tier, Black applicants' denials were attributed to Credit History at meaningfully higher rates than White applicants' denials in that same tier (47% vs. 33%). Income did not close that gap.
None of this tells you what will happen with your specific application — every lender underwrites differently, and the factors that actually drive an approval (credit score, existing debt, documented income, the property itself) are individual to you. But a few practical takeaways for any Houston homeowner shopping for a HELOC or cash-out refinance:
We'll keep tracking this data as new HMDA years are released. If you're weighing a HELOC, a cash-out refinance, or want a second read on an application you're not sure about, Luxintel Property is happy to walk through your specific numbers.
Daniel Lee is a Texas real estate agent (TREC #838122, Callis & Co Realty) and mortgage loan originator (NMLS #2714789, Straight Arrow Mortgage), operating under the Luxintel Property brand. This analysis is based on publicly available HMDA data and reflects reported lending outcomes, not individualized underwriting advice.


 Erase note
 You currently have no custom folders