Sign In
Create an account and enjoy all the benefits of HAR.com!
Sign In
Sign in using social account

An evaluation of pricing metrics reveals a decoupling between existing home values and new construction values starting in 2024.
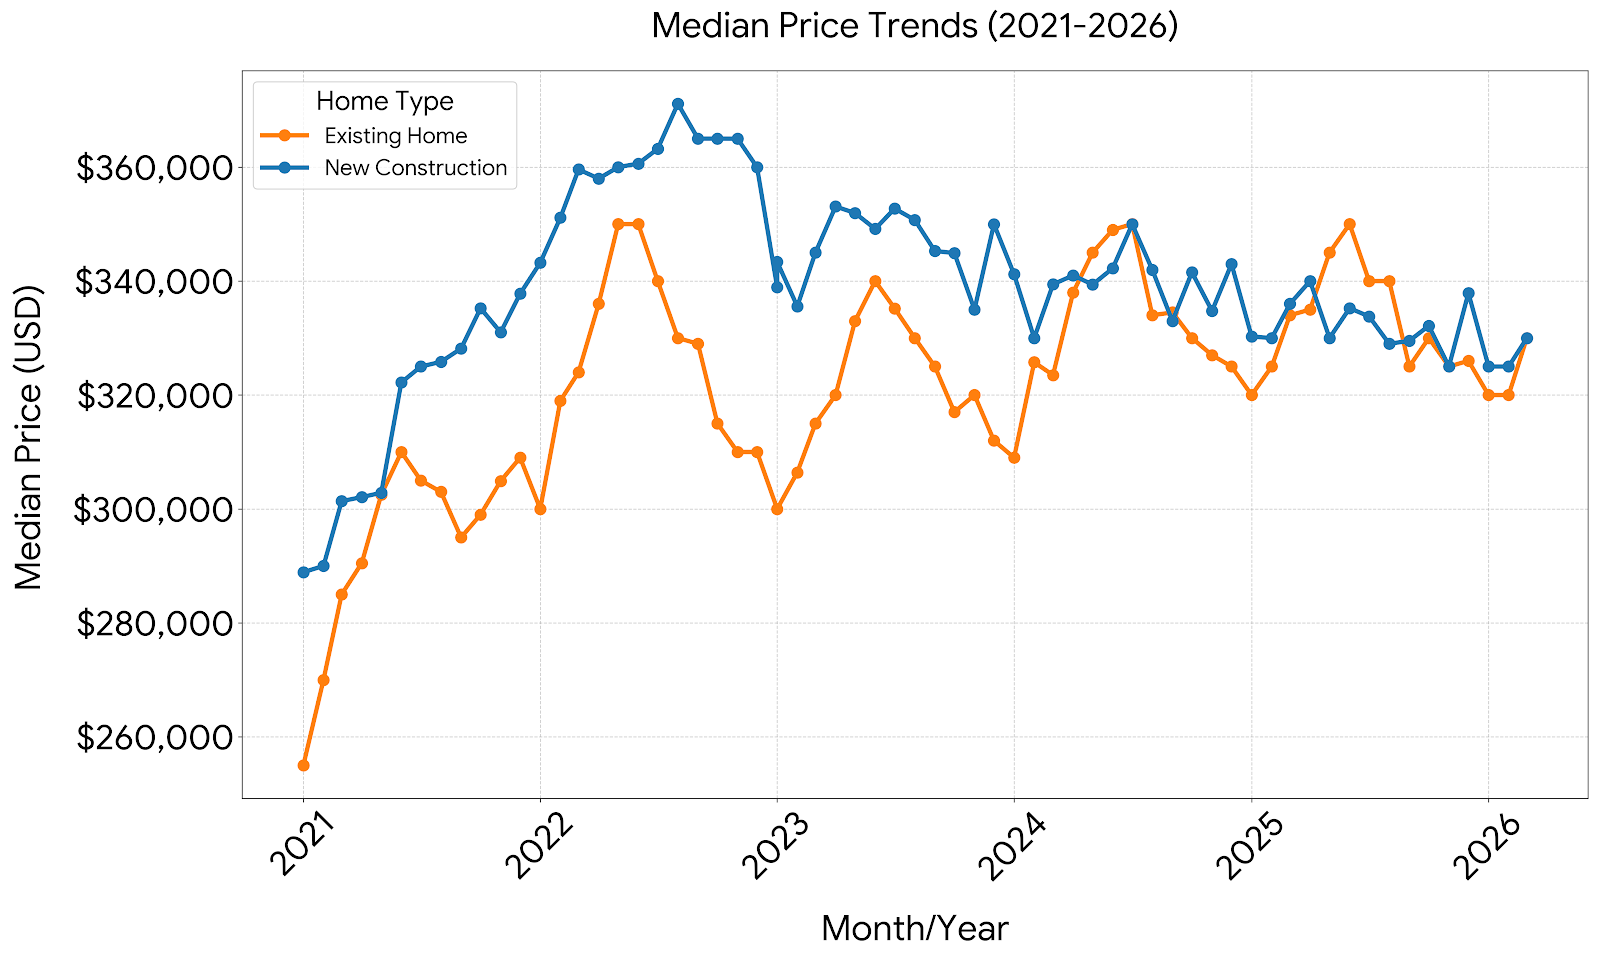
The Post-Pandemic Run-Up (2021 Mid-2022): Both sectors experienced meteoric rises. Existing homes skyrocketed from a median of roughly $255,000 in early 2021 to a peak of $350,000 by mid-2022. New construction maintained a premium, moving from around $289,000 to an all-time high near $370,000 over the same period.
The Rate-Shock Correction (Mid-2022 Early 2023): As mortgage rates rose, median prices collapsed symmetrically. Existing homes hit a localized floor at $300,000, while new construction dropped back to roughly $335,000.
The Great Divergence (20242026): While both sectors stabilized into seasonal waves, by late 2025/early 2026, existing home median prices held relatively firm in the $320,000$330,000 range. New construction median prices, which previously commanded a major premium, compressed significantly, matching or occasionally dipping near existing home medians.
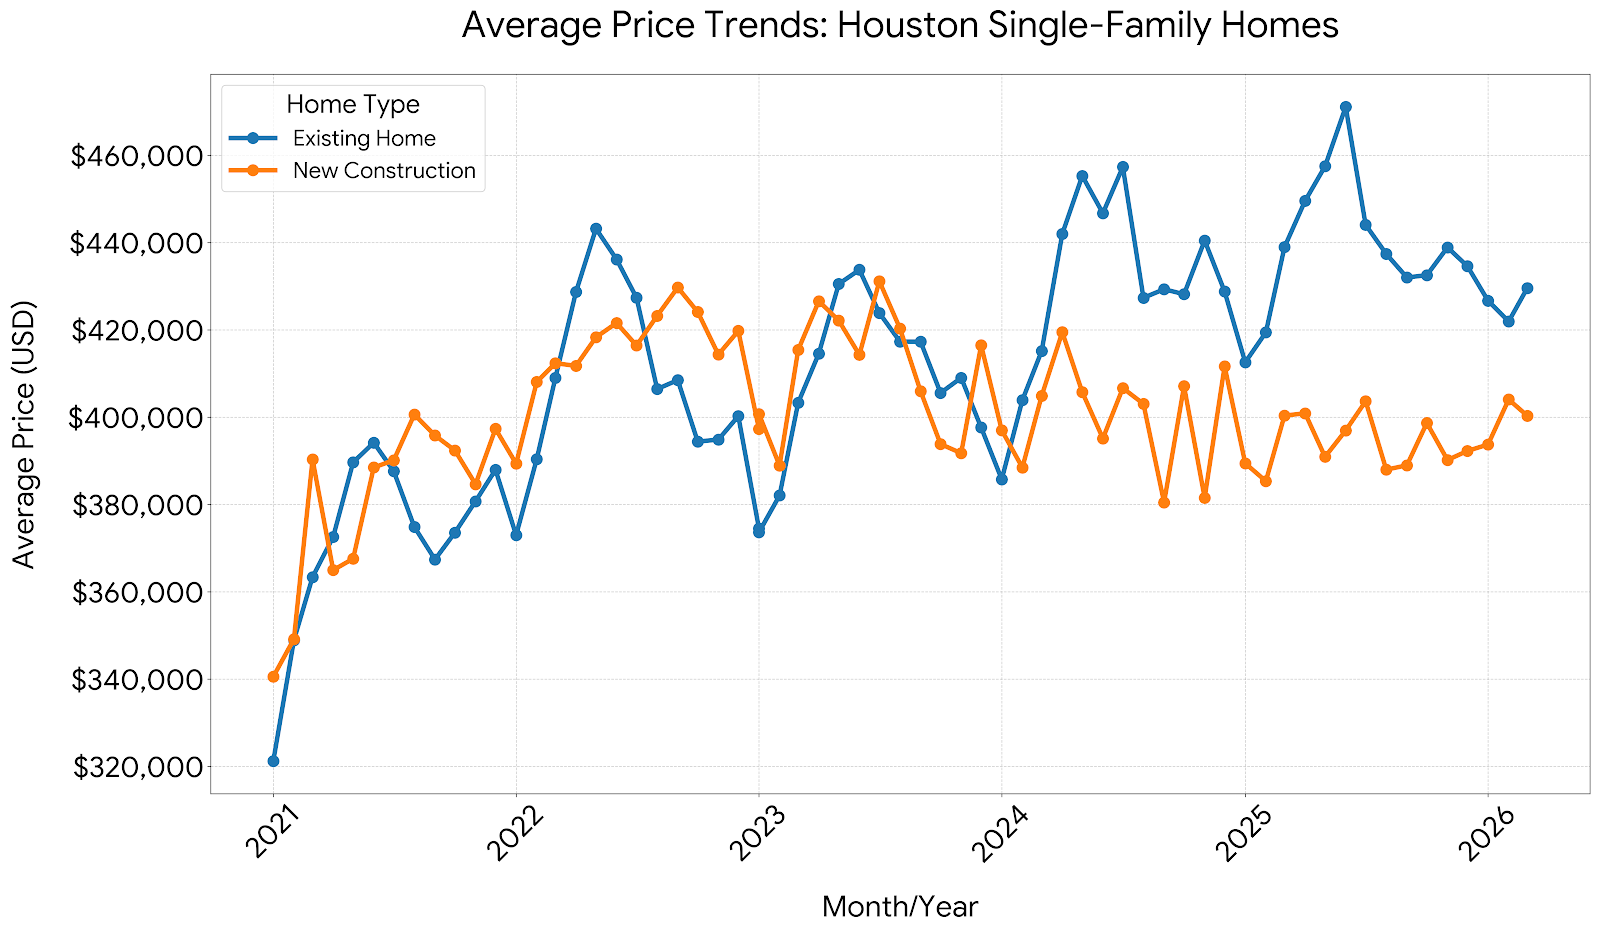
The average price trends showcase an even wider divergence. Existing home average prices achieved a significant historical high in mid-2025, spiking over $470,000, driven by luxury/premium existing home sales and the "rate lock-in" effect squeezing mid-tier inventory.
Conversely, new construction average prices plateaued and consistently compressed down to the $390,000$400,000 range by 2026, demonstrating that homebuilders are downsizing floor plans and building smaller, more affordable inventory to match buyer purchasing power.
The interaction between Active Listings and Days on Market provides a clear picture of shifting market balance.
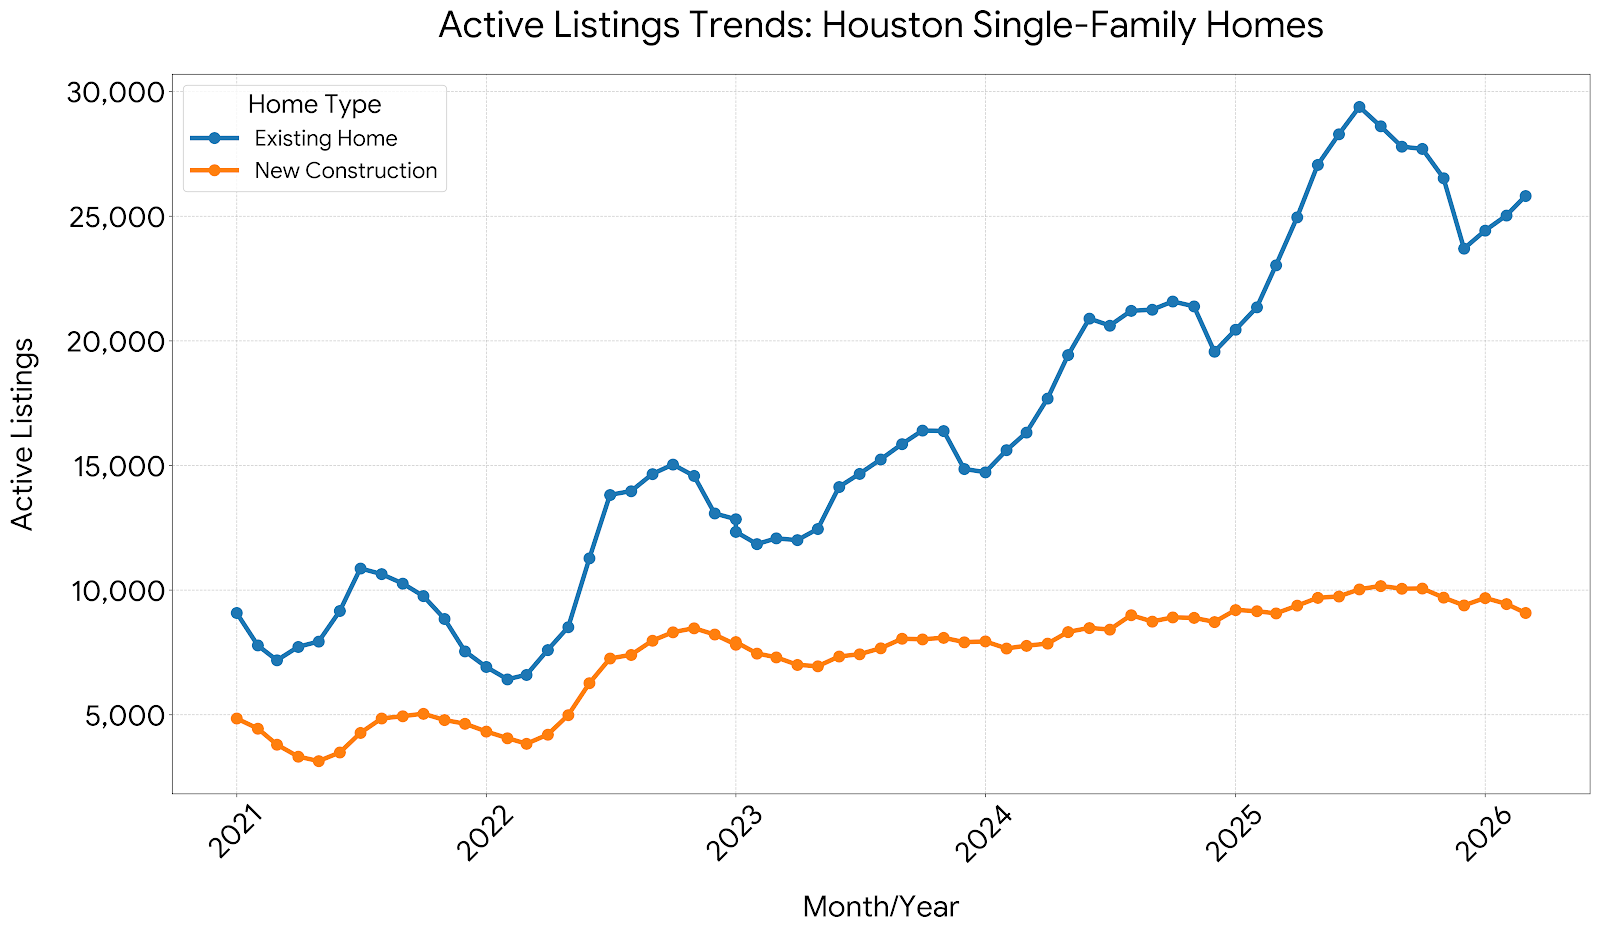
Active listings for existing homes hit a historical bottom in late 2021/early 2022 near 6,500 units.
From mid-2024 through late 2025, active listings exploded, peaking at nearly 30,000 homes before a minor seasonal drawdown heading into 2026.
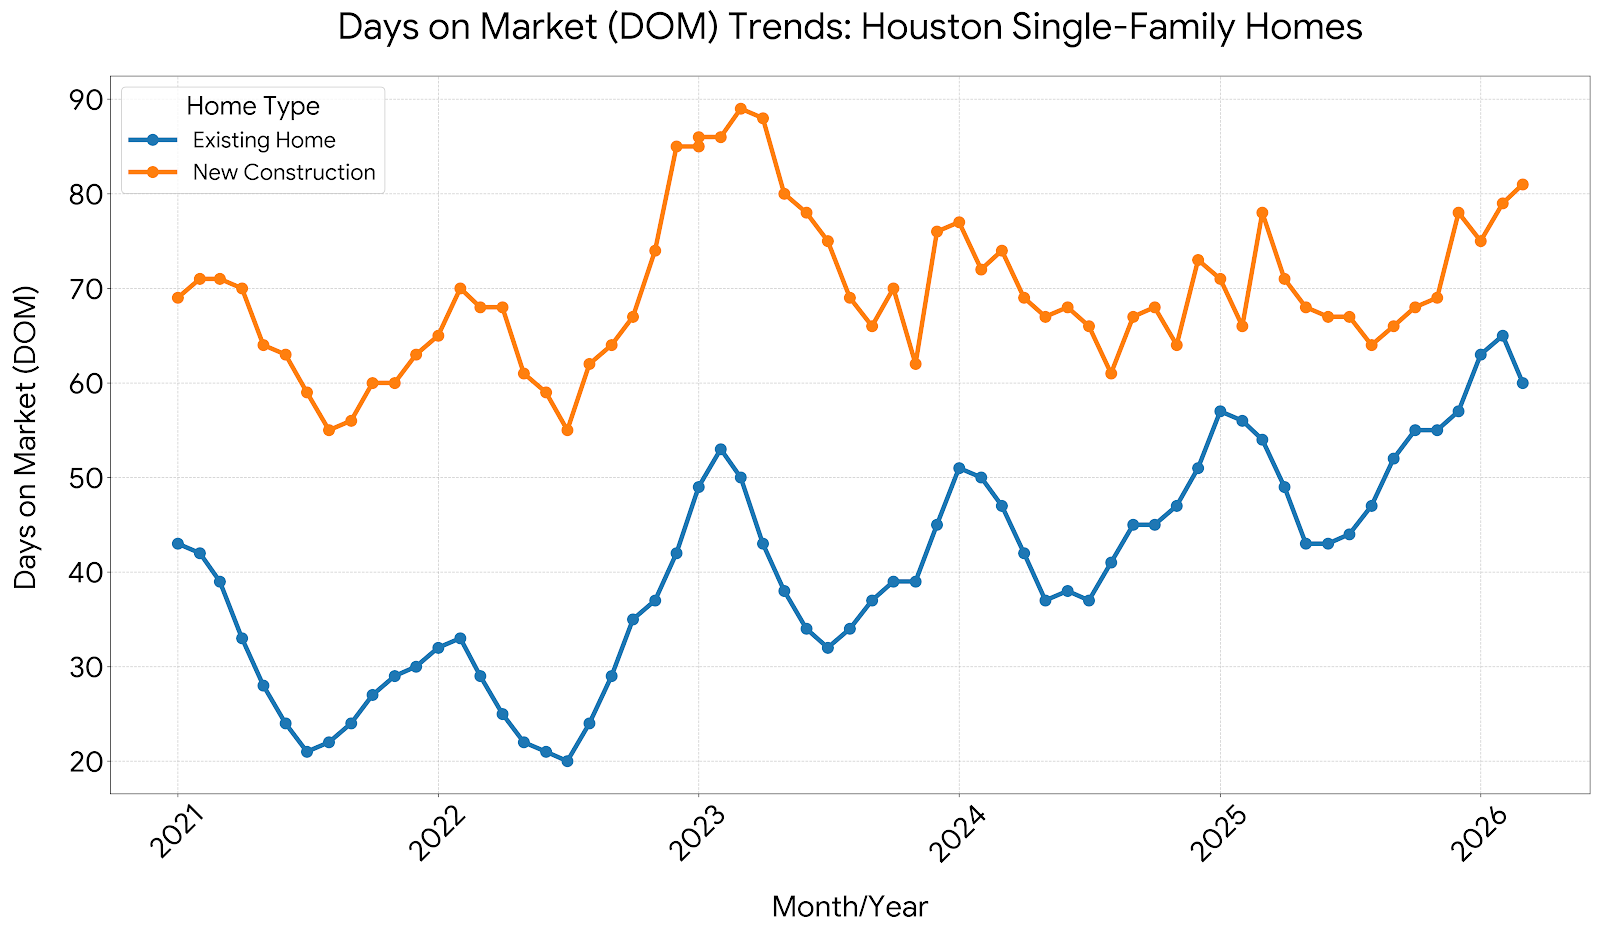
The Velocity Anomaly: Despite active listings quadrupling since 2022, closed sales stayed remarkably stable, hovering between 3,500 and 6,000 transactions per month. This means inventory is accumulating because homes are sitting longer, not because transactions have entirely frozen. Existing home DOM consequently rose from an ultra-fast 20 days in 2022 to over 60 days by early 2026.
Builders experienced an accumulation of active listings from 2021 (under 4,000 units) to mid-2025 (peaking over 10,000 units).
However, new construction DOM has consistently hovered significantly higher than existing homes, remaining between 65 and 90 days. Because building takes time, inventory build-up is slower to clear.
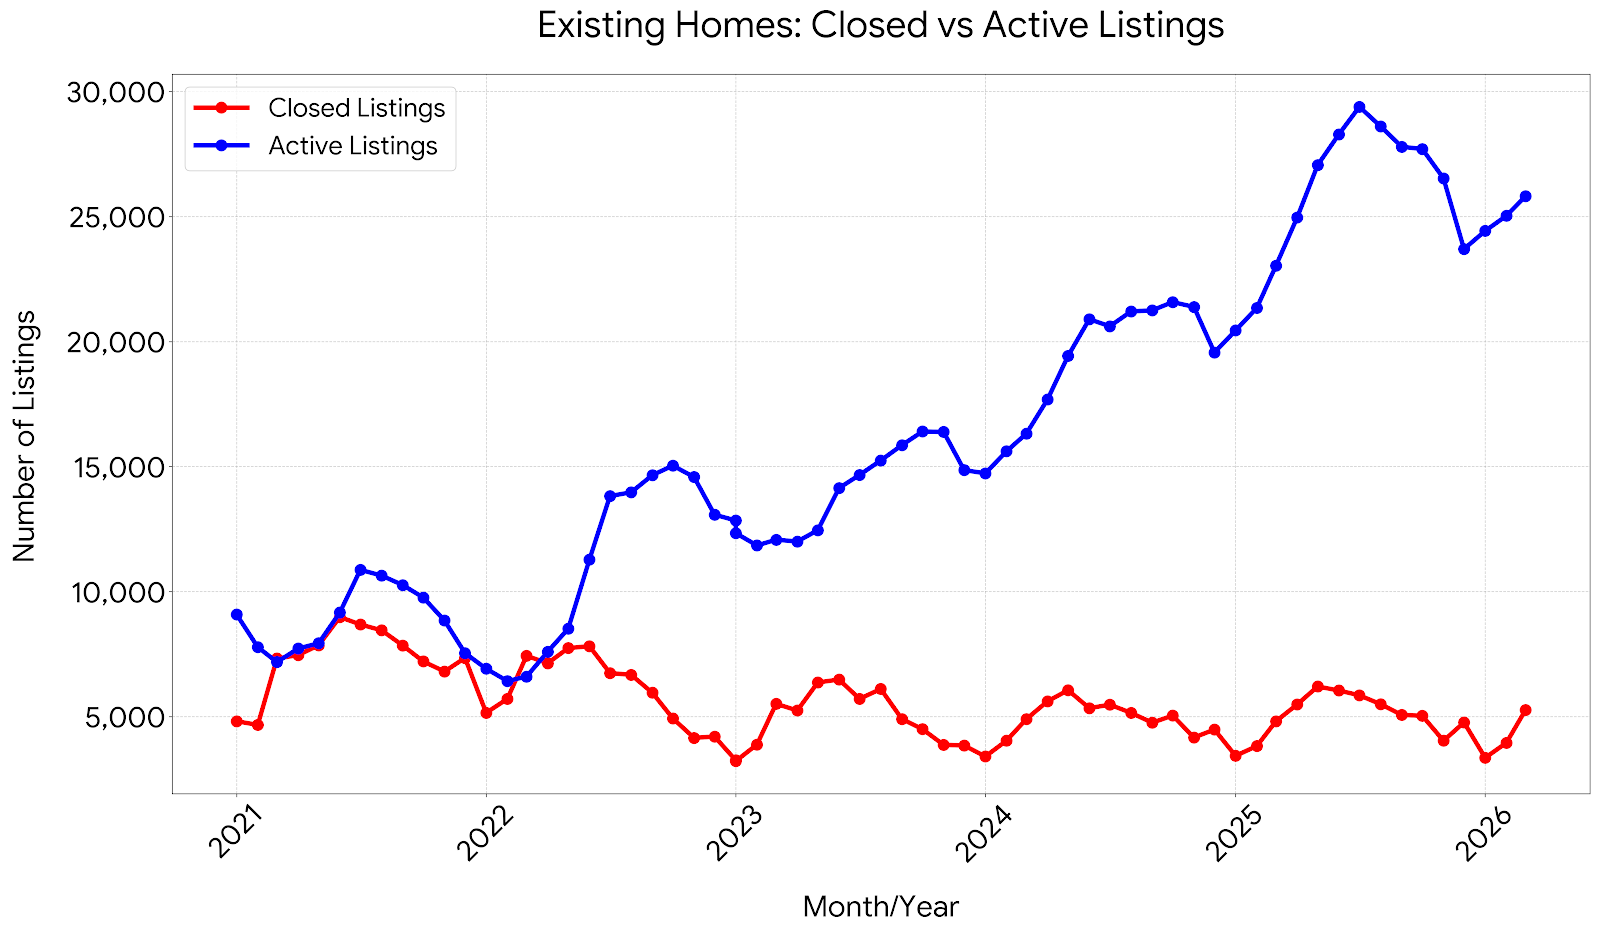
Based on the Closed vs Active Listings for existing homes, the resale market shows a classic pattern of inventory accumulation amidst stagnant transaction volume.
The Inventory Surge: Active listings for existing homes hit a historical low in late 2021/early 2022, bottoming out between 5,000 and 7,000 units. From 2022 onward, active listings entered a massive multi-year upward trajectory, peaking in mid-2025 at nearly 30,000 homes before experiencing a seasonal dip and stabilizing over 25,000 listings in early 2026.
Stagnant Demand Dynamics: Despite active inventory quadrupling from its 2022 floor, the number of closed listings has remained locked in a flat, tightly bound horizontal range, consistently fluctuating between roughly 3,500 and 8,000 closures per month.
Market Imbalance: The widening gap between the blue (Active) line and the red (Closed) line highlights that supply has significantly outpaced active demand. Houses are staying on the market longer, shifting massive amounts of leverage back over to buyers in the resale sector.
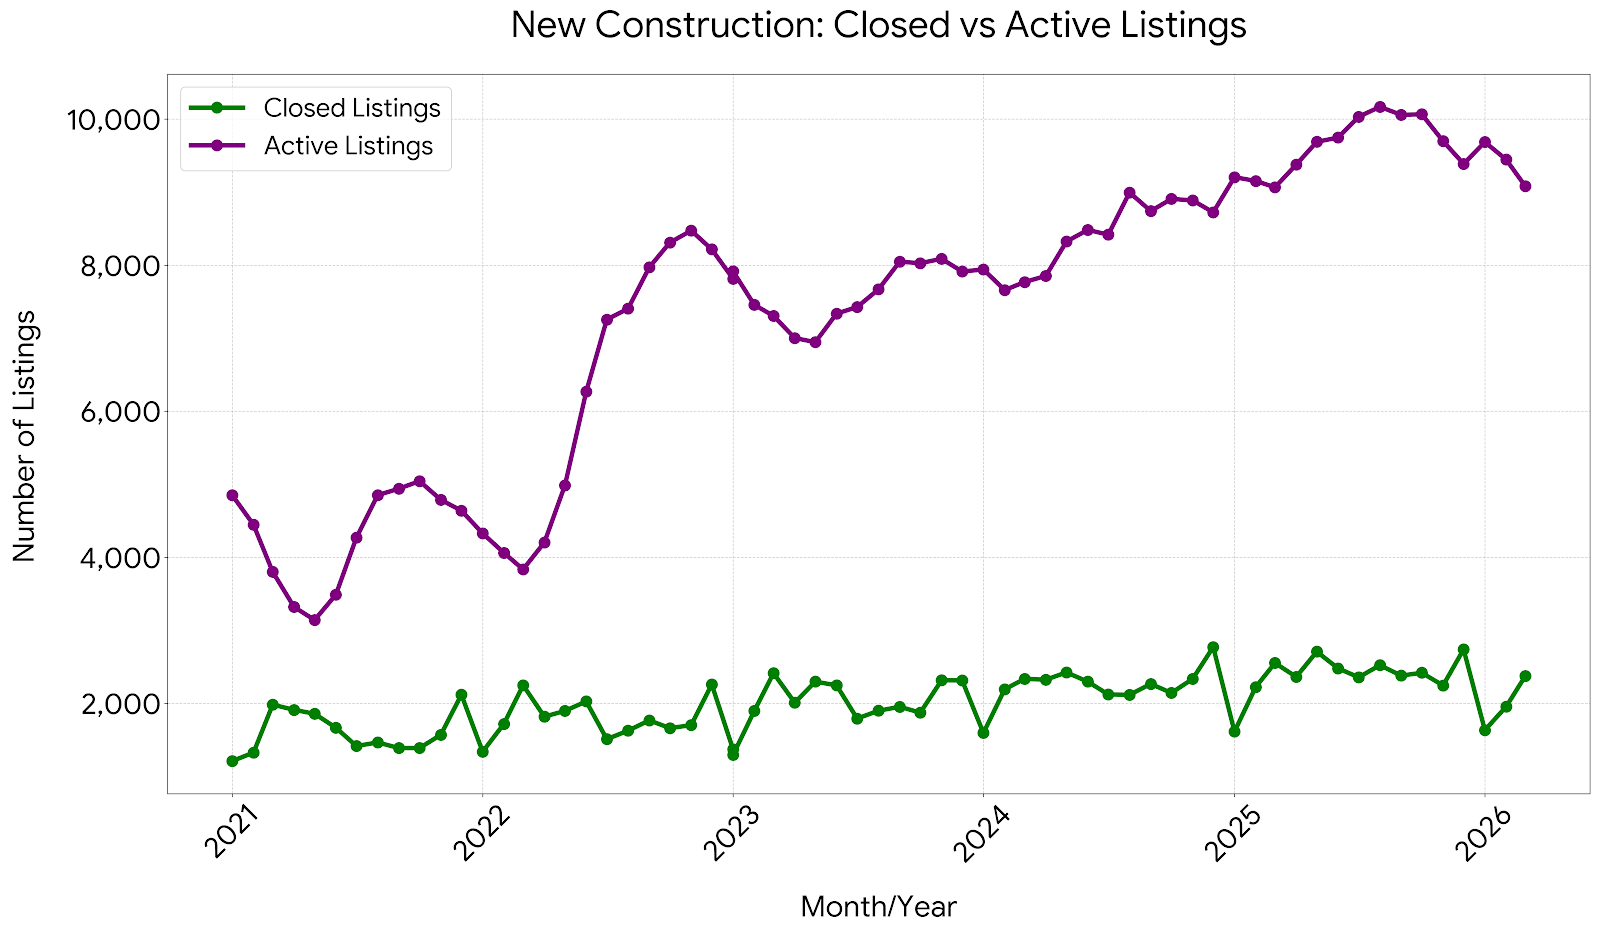
Based on the Closed vs Active Listings for new homes, the single-family builder market exhibits a much more tightly managed, corporate-driven supply curve.
Controlled Inventory Influx: Similar to resales, new construction active listings dropped to a low point in mid-2021 (around 3,000 units). Inventory climbed rapidly through late 2022 to around 8,500, plateaued through 20232024, and reached its absolute peak in mid-2025 at just over 10,000 active listings. By early 2026, active builder inventory pulled back to around 9,000 units.
Remarkably Flat Sales Volume: The closed listings line (green) for new construction is exceptionally flat compared to the resale market, consistently staying between 1,200 and 2,800 closings per month across the entire five-year span.
Strategic Adaptability: While active inventory is roughly three times higher than closed volume, homebuilders have managed to prevent a runaway supply collapse by pacing their construction starts and using aggressive builder incentives (rate buy-downs, price cuts) to keep their closing pipeline highly predictable.
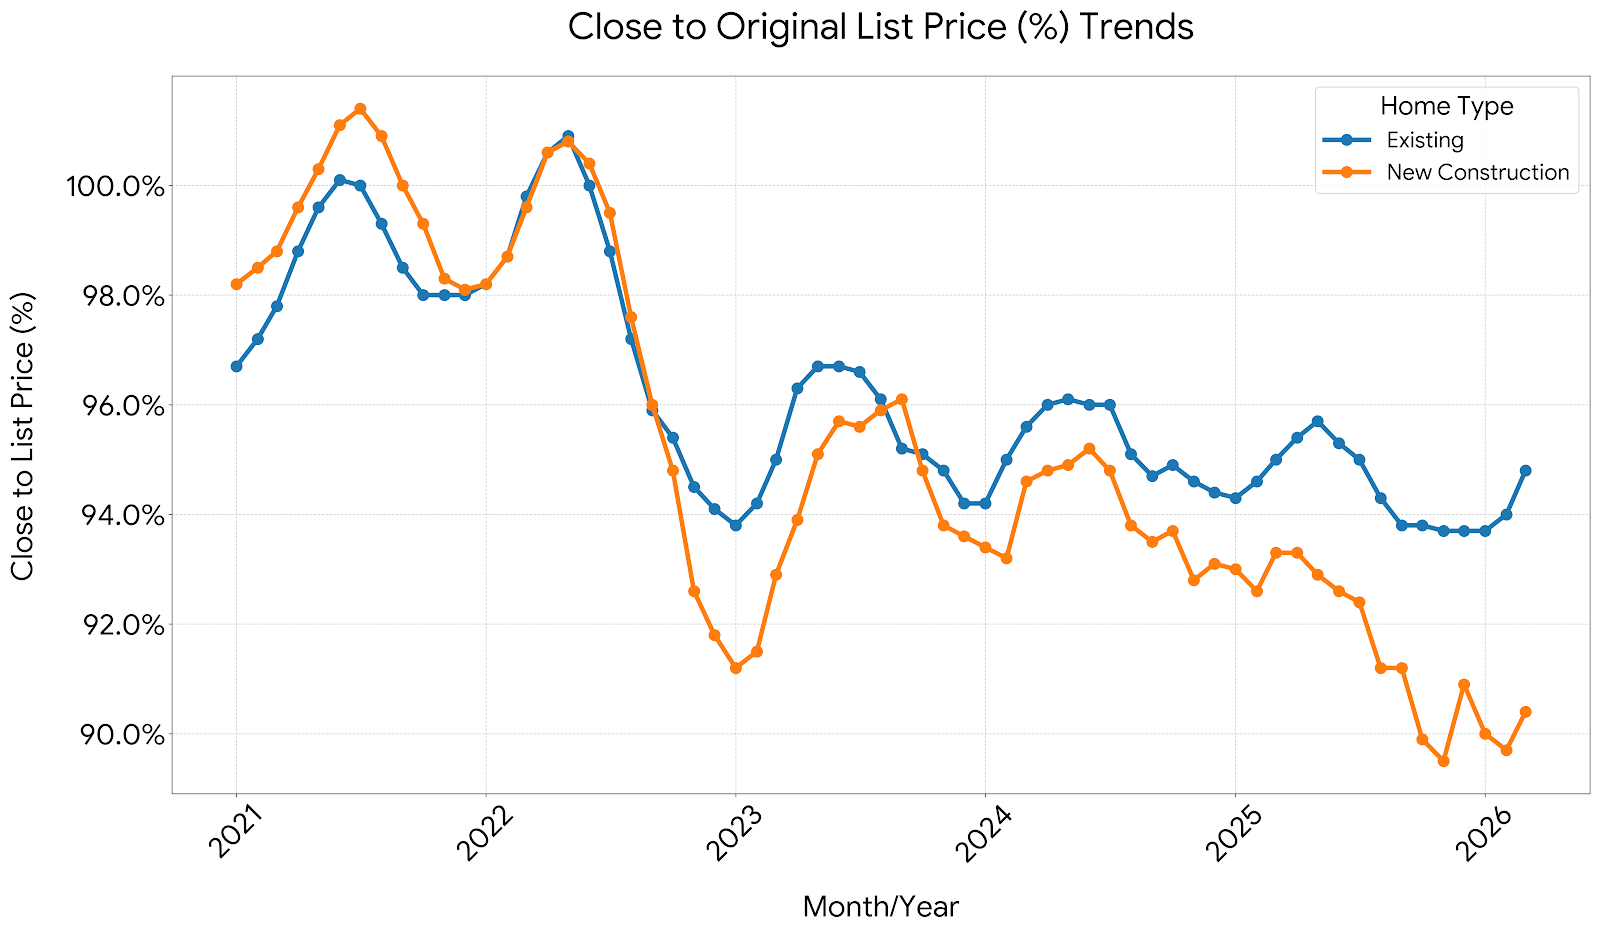
The Close-to-Original-List-Price Percentage is the ultimate barometer for market leverage.
The Hyper-Seller's Market (20212022): In 2021 and mid-2022, bidding wars pushed close-to-list ratios past the 100% threshold for both segments, peaking near 101.5% for new construction and 100% for existing homes. Sellers dictated all terms.
The Post-2023 Corrective Era: By 2023, the ratio plunged below 94% for new construction and 97% for existing homes.
The 2026 Buyer's Haven for New Builds: By early 2026, a massive chasm opened up between the two segments:
Existing Homes: Settled around 94%95%, showing that traditional sellers are negotiating, but maintaining a baseline floor.
New Construction: Plummets to an all-time low of under 90.5%. This quantitative steep drop indicates that homebuilders are aggressively cutting prices, offering massive flex-cash incentives, buying down interest rates, and slashing list prices to move standing inventory off their balance sheets.
The data indicates that 2026 represents one of the most builder-vulnerable windows in half a decade. With new construction close-to-list price ratios dipping toward 90%, buyers possess massive leverage over corporate builders who face high carrying costs on finished specs. Additionally, the convergence of median prices means buyers can purchase brand-new energy-efficient inventory for nearly the same price as an older, existing home.
While your home is no longer selling in a weekend with multiple offers above ask, you are insulated by a lack of distressed selling. Even with active inventory sitting near historical highs of 25,000+ units, average pricing remains historically high. Sellers must adjust to a market normalized around 60 Days on Market and expect to compromise on roughly 5% off their original asking price during negotiations.
