Home Value Report
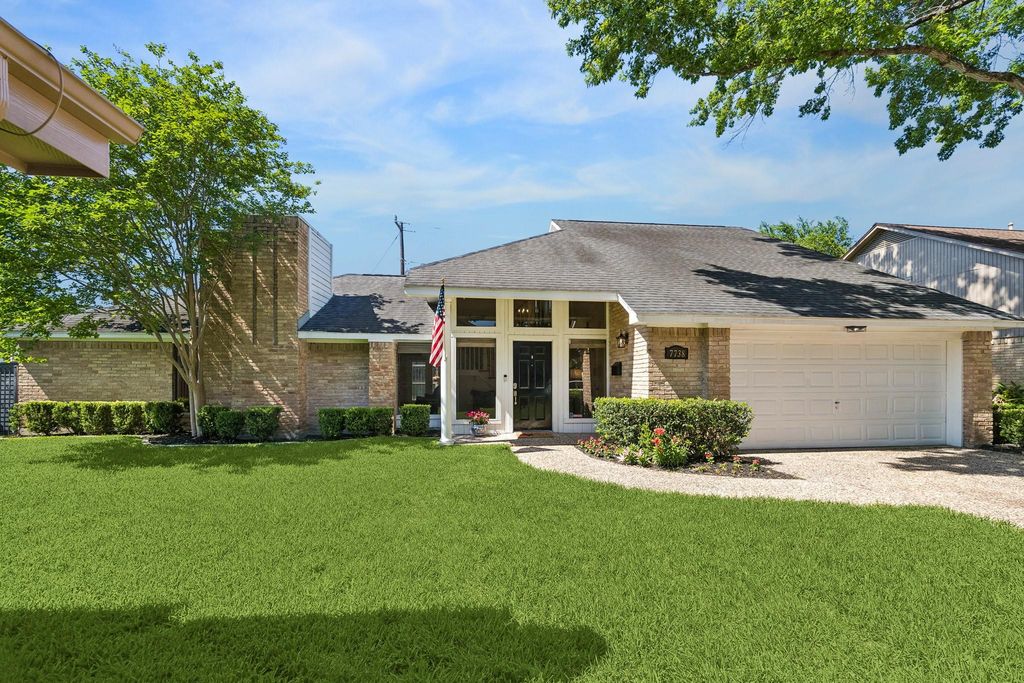
7738 Betty Jane Ln
HOUSTON, TX 77055
Currently not for sale
$336,499
2025
Market Value Per Appraisal District
| Bedrooms | 3 |
| Full Bathrooms | 2 |
| Half Bathrooms | 1 |
| Built Square Feet | 1,950 |
| Lot Square Feet | 5,523 |
Valuations by Third Party Providers
Using a REALTOR is the best way to determine the market price of a home. Start this process by viewing the third-party valuations and then contact a Realtor to determine a reasonable purchase price for a home.
|
AVM Value
$780K
$400.00/sqft
|
AVM Value
$610K
$312.97/sqft
|
AVM Value
$336K
$172.56/sqft
|
|
Value Range
$468K - $1.09M
|
Value Range
$561K - $660K
|
Value Range
$ 336,499
|
|
Confidence Score
60% Margin of Error*: 40%
|
Confidence Score
86% Margin of Error*: 8%
|
Confidence Score NA
|
Limitations: This represents an estimated sale price for this property. It is not the same as the opinion of value in an appraisal developed by a licensed appraiser under the Uniform Standards of Professional Appraisal Practice. The values do not include a physical or visual inspection of the subject property. User shall not use the values in lieu of an appraisal by a licensed appraiser or as a basis for making any financial decision.
Loading...
General Description
7738 Betty Jane Ln (currently not for sale) is located in Clay Woods subdivision in Harris County. Scroll to see the property features, tax value, mortgage calculator, nearby schools and similar homes for sale. The property information herein and below is from the county appraisal district and should be independently verified.
| Listing Status | Currently not for sale |
| Market Value | $336,499 |
| Address | 7738 Betty Jane Ln |
| City | HOUSTON |
| State | TX |
| Zip Code | 77055 |
| County | Harris County |
| Subdivision | CLAY WOODS |
| Legal Description | TR 18B BLK B (RESUB LTS 18 & 19) CLAY WOODS |
| Bedroom | 3 Bedroom(s) |
| Bath | 2 Full & 1 Half Bath(s) |
| Stories | 1/Appraisal District |
| Building Size | 1,950 Sqft/Appraisal District |
| Lot Size | 5,523 Sqft/Appraisal District |
| Year Built | 1979 / Appraisal District |
Property Tax
Cost/Sqft Based on Market Value
| Tax Year | Cost/Sqft | Market Value | Change | Tax Assessment | Change |
|---|---|---|---|---|---|
| 2012 | $142.25 | $300,000 | $300,000 | ||
| 2013 | $139.88 | $295,000 | -1.67% | $295,000 | -1.67% |
| 2014 | $185.27 | $390,740 | +32.45% | $390,740 | +32.45% |
| 2015 | $153.50 | $323,739 | -17.15% | $323,739 | -17.15% |
| 2016 | $153.50 | $323,739 | 0.00% | $323,739 | 0.00% |
| 2017 | $153.50 | $323,739 | 0.00% | $323,739 | 0.00% |
| 2018 | $153.50 | $323,739 | 0.00% | $323,739 | 0.00% |
| 2019 | $157.53 | $332,239 | +2.63% | $332,239 | +2.63% |
| 2020 | $157.53 | $332,239 | 0.00% | $332,239 | 0.00% |
| 2021 | $137.40 | $289,785 | -12.78% | $289,785 | -12.78% |
| 2022 | $145.82 | $307,538 | +6.13% | $307,538 | +6.13% |
| 2023 | $161.74 | $341,107 | +10.92% | $341,107 | +10.92% |
| 2024 | $160.65 | $338,803 | -0.68% | $338,803 | -0.68% |
| 2025 | $159.55 | $336,499 | -0.68% | $336,499 | -0.68% |
2025 County Appraisal District Tax Value
| Market Land Value | $193,632 |
| Market Improvement Value | $142,867 |
| Total Market Value | $336,499 |
| Total Tax Amount | $7,643 |
2025 Tax Rates
| SPRING BRANCH ISD | 1.0231 % |
| HARRIS COUNTY | 0.3810 % |
| HC FLOOD CONTROL DIST | 0.0497 % |
| PORT OF HOUSTON AUTHORITY | 0.0059 % |
| HC HOSPITAL DIST | 0.1876 % |
| HC DEPARTMENT OF EDUCATION | 0.0048 % |
| HOUSTON CITY OF | 0.5192 % |
| SPRING BRANCH MGMT DISTRICT | 0.1000 % |
| Total Tax Rate | 2.2712 % |
Learn more about
Harris County Appraisal District →
Harris County Appraisal District →
Copyright© 2026, HOUSTON REALTORS® INFORMATION SERVICE, INC. All Rights Reserved.