Sign In
Create an account and enjoy all the benefits of HAR.com!
Sign In
Sign in using social account
New listings outpaced 2022 by 13.8% indicating there are still sellers who want or need to sell their homes. This is good news for buyers and not-so-great news for sellers.
Pre-Pandemic: Versus 2019 listings increased by almost the same percentage.
Pending listings were higher this past week than the same week in 2022. The 2.3% increase was the first in months. This indicates there are not only sellers wanting or needing to sell but there continue to be buyers ready to purchase a new home. How can buyers afford to buy with such high mortgage interest rates? With home prices increasing significantly over the past few years sellers are receiving much higher equity at closing. This allows them to either pay cash or put down a significantly large down payment on their new home. Certainly, a higher interest rate is less important when you are financing 50% or less of your home purchase. We are also seeing builders offering reduced interest rates as low 4.75%. Those home sales are boosting the pending listings statistic. I RECOMMEND YOU NEVER PURCHASE A NEW CONSTRUCTION HOME WITHOUT THE SUPPORT OF A REAL ESTATE AGENT. BUILDER SALESPERSONS WORK FOR THE BUILDER WHILE YOUR REAL ESTATE AGENT WORKS FOR YOU!
Pre-Pandemic: A discouraging statistic is when compared to the same week in 2019 pending listings were down 16.4%. This is a continuing trend when we compare 2023 to 2019
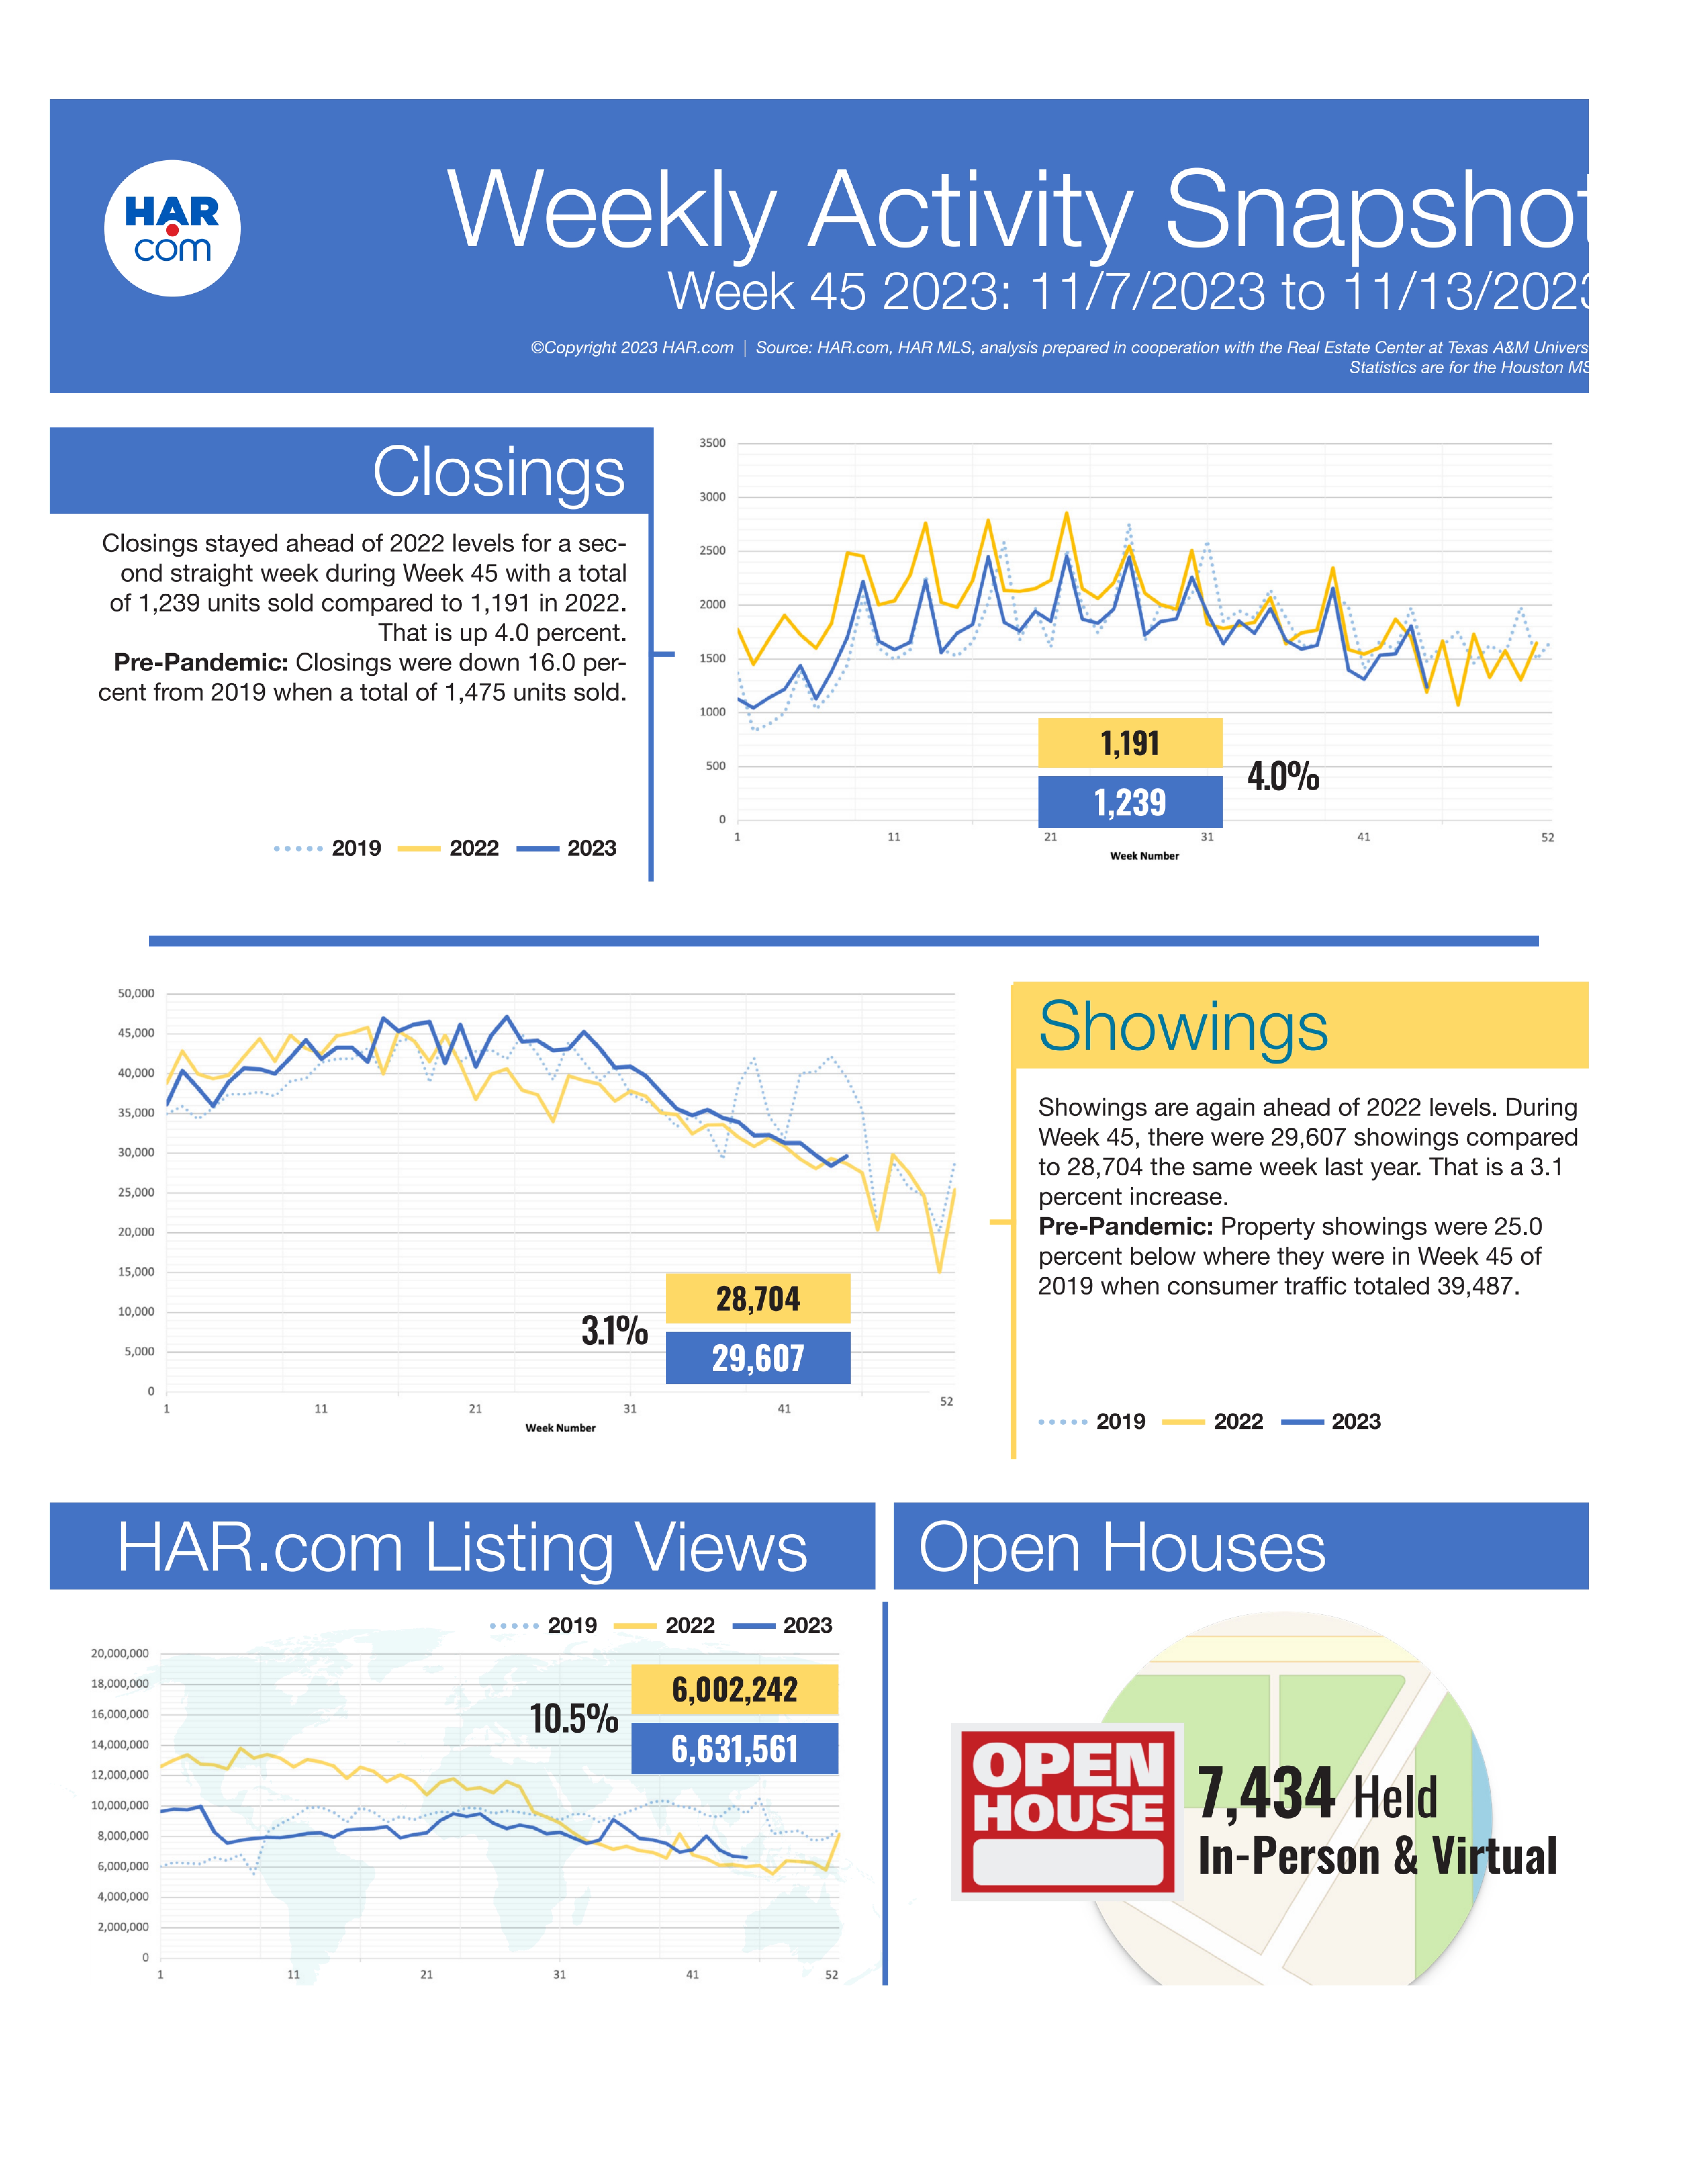
Closings for week 45 of 2023 were up 4.0% over 2022. As with the pending statistic, this indicates buyers are still in the market and how important it is not to over-price your home.
Pre-Pandemic: Closings were significantly behind 2019 at 14.7%.
Sellers Withdrew fewer property listings from the MLS during the week ending November 13th than that same week in 2022. Week-over-week off-market listings decreased by 2.3%.
Pre-Pandemic: Sellers withdrew fewer property listings versus Week 45 of 2019 when off-market listings totaled 1,679. That is a drop of 15.2 percent.
Property Showings for Week 45 of 2023 were 29,607; nearly keeping pace with the strong number from Week 44.
Pre-Pandemic: When compared to Week 45 the numbers were discouraging. Showings were down by more than 25% when compared to 2019.
Listing Views on HAR.com and the HAR app were up 10.5% over 2022. There were 6,631,561 this past week (versus 6,002,242 in 2022).
Pre-Pandemic: While the increase from 2022 to 2023 is encouraging we are still trending significantly below 2019 online views that were more than 10,000,000 in 2019.
