Sign In
Create an account and enjoy all the benefits of HAR.com!
Sign In
Sign in using social account
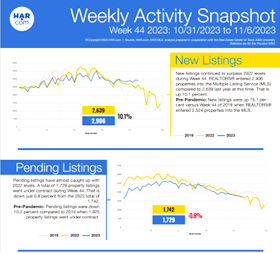
The influx of NEW LISTINGS persisted in surpassing the levels observed in 2022 during Week 44 of the current year. REALTORS® introduced 2,906 properties into the Multiple Listing Service (MLS), marking a notable increase from the 2,639 recorded at the same period last year, reflecting a 10.1% rise. Although still falling short of the balanced inventory requisite for our market, this development is favorable for prospective buyers, as it expands the range of available homes for selection.
In a pre-pandemic context, the surge in new listings amounted to a 15.1% increase compared to Week 44 of 2019 when REALTORS® registered 2,524 properties in the MLS.
Conversely, there was an elevated withdrawal of property listings from the MLS during the week concluding on November 6, surpassing figures from the corresponding week in 2022. Off-market listings experienced a 13.4% uptick, with a total of 1,882 homes transitioning from active to off-market, in contrast to the 1,659 recorded in the preceding year. It is noteworthy that as long as this withdrawal figure remains lower than the rate of new listings, our market is poised to maintain its trajectory toward achieving a balanced inventory that neither favors sellers nor buyers.
In a pre-pandemic scenario, sellers withdrew fewer property listings compared to Week 44 of 2019 when off-market listings totaled 2,318.
Pending listings have nearly reached parity with 2022 levels, with a total of 1,729 property listings entering into contracts during Week 44. This reflects a marginal decrease of 0.8% from the 2022 total of 1,742.
In a pre-pandemic comparison, pending listings were down 10.2% in relation to 2019 when 1,925 property listings were placed under contract.
Property showings, on the other hand, have slightly lagged behind 2022 levels, with 28,434 showings recorded during Week 44 compared to 29,340 in the same week of the preceding year, indicating a decline of 3.1%.
In a pre-pandemic context, property showings were 32.6% below the levels observed in Week 44 of 2019 when consumer traffic totaled 42,204.
Closings have surpassed 2022 levels for the first time since Week 37, with a total of 1,807 units sold compared to 1,699 in 2022, reflecting a 6.4% increase.
Pre-pandemic data indicates that closings were down 8.6% from 2019 when a total of 1,977 units were sold.
Listing Views on HAR.com and the HAR app exhibited a 9.0% increase over 2022, totaling 6,153,090 in 2022 compared to 6,707,067 in 2023.
Despite this positive trend, it is important to note that we still trail significantly behind 2019 online views, which surpassed 8,600,000 in that year.
