The most appealing features of late 2022’s housing market for buyers lower prices and increased inventory were largely caused by their new obstacle: higher mortgage rates.
When mortgage rates hovered around 3%, they played a small role in homebuying budgets, and, if anything, encouraged would-be buyers to make hay. With each fraction of a percentage point increase, however, buyers had to take the impact of interest more seriously.
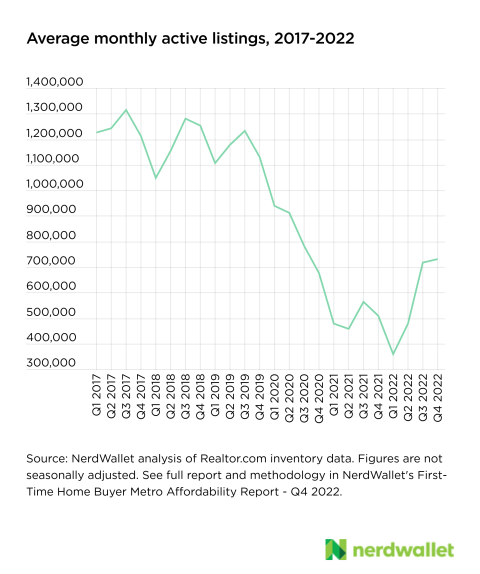
Mortgage rates began climbing from their pandemic lows in the first quarter of 2022; they peaked in the fourth, with 30-year fixed-rate mortgages topping 7% in October and November. And with that peak, demand for homes plummeted.
With fewer buyers competing in the fourth quarter of last year, home prices came down 5% nationwide, and inventory increased.
Typical income went further toward the purchase of homes in the fourth quarter of 2022 than in the third. Nationwide, homes were listed at 5.4 times first-time home buyer income, compared with 5.7 in the third quarter.
This positive change is attributed to both of the key measures in our affordability ratio home prices and income. Prices came down and real income grew. Nevertheless, homes remain widely unaffordable, particularly when you consider the common (if outdated) rule of thumb that buyers shop for homes priced at three times their income.
For the first time since this analysis began in the fourth quarter of 2020, though, two metro areas were deemed affordable Pittsburgh, where homes were listed at 2.6 times first-time home buyer income, and Cleveland, where they were listed at 2.9 times first-time buyer income.
Two metros saw small declines in home affordability. In Kansas City, homes were listed at 5 times first-time buyer income versus 4.9 times in the previous quarter, and in Milwaukee, they rose to 4.8 times first-time buyer income versus 4.7.
First-time buyer guidance: In most locations, looking only at homes with prices three times your income right now is unrealistic your search results would be nearly empty. Instead, find out what homes are selling for where you’re hoping to buy and determine whether those prices are manageable given your personal circumstances. Other debt obligations, current mortgage rates and the size of your down payment all play central roles in identifying your target price range. A home affordability calculator can help.
Relatively high mortgage rates in the fourth quarter continued to bring demand down, leading first to a pause in the white-hot price growth, then price declines in at least some markets.
List prices fell 5% nationwide and 3% across the most populous metros in the fourth quarter, after adjusting for inflation. Only eight metros saw price increases, and they were modest ranging from 1% to 3%.
Some of this may be seasonal. We know prices typically begin coming down from the fourth quarter through the first quarter, before climbing in the spring. But the lull in growth is a welcome sight and something we haven’t observed for the past two (unusual) years.
First-time buyer guidance: Sellers can command higher prices in warmer months as demand begins heating up in the spring. But buying at the coldest time of year to try to save money generally comes with a trade-off: fewer newly listed homes. Buyers, and especially first-time buyers, should instead focus on the home they want within their price range. By keeping an eye out while amassing a down payment and working on your credit, you can be prepared to pounce when the right listing comes your way, no matter the season.
Like prices, the number of homes on the market typically ebbs in colder months. However, we didn’t see this seasonal trend in the last quarter of 2022 when the number of listings stayed relatively stable from the previous quarter, rising 1% across the most populous metros and 2% nationwide.
There is evidence of vast improvement when compared with inventory levels at the same time in 2021. Across the nation, there were 44% more listings, on average, in Q4 2022 compared with a year earlier. In the nation’s most populous areas, active listings climbed 63% on the year.
First-time buyer guidance: Having more homes to choose from is certainly good news, but buyers should be prepared to be flexible. Most local markets are still operating on a deficit there aren’t enough homes available for the people who want to buy at the prices they can afford. Have an idea of what your dream house may look like, but take a realistic view of all of the features you may need to compromise on. In other words, make a wish list and make a must-have list. More than likely, you’ll find a home that fits between those two.
In 2020 and 2021, home inventories were slashed, sometimes by half, at a time when low rates helped drive demand incredibly high, tilting the market power entirely into the hands of home sellers. Now, however, supply is beginning to stage a comeback.
Five metro areas had higher inventory in the fourth quarter of 2022 than in the fourth quarter of 2019, the last full quarter before the pandemic began. And those areas represent some of the hottest markets of recent years: Phoenix, where there were 24% more listings in the most recent quarter; Austin (+15%), Las Vegas (+10%), Salt Lake City (+9%) and San Francisco, where there were 7% more listings than three years prior.
The nation wasn’t awash in home listings before the COVID-19 pandemic the shortage of available homes is an issue that goes beyond the past three years. However, a return to pre-pandemic inventory can make home shopping feel less futile, and help balance power between buyers and sellers in the market.
But some markets have a long way to go. The Hartford, Connecticut, metro area is furthest from pre-pandemic inventory, with 249% fewer listings in the fourth quarter of 2022 compared with three years ago; Providence, Rhode Island (-133%), and Virginia Beach, Virginia (-130%), are also still in a significant deficit.
Analysis methodology and additional data available in the original article, published at NerdWallet.
Subscribe to our monthly newsletter for up-to-date real estate industry trends, news, and insights.

