Oh Give Me a (Single-Family Rental) Home

The supply of single-family homes for sale remains tight in many markets across the United States. This is especially true for more affordable homes that sell below an area's median home price.
Unfortunately, Texas is not immune to the shortage. Although housing affordability has been one of the state's many strengths, individuals and families across much of Texas are finding it harder to purchase a moderately priced single-family home.
When buying is not an option, some households will attempt to rent detached single-family homes rather than live in apartments. However, this alternative is becoming increasingly difficult, especially to lower-income households.
To understand why, the Real Estate Center looked at the environment that led to the single-family rental market's growth since the Great Recession (GR) and the factors that impact its viability as an affordable housing option. Researchers analyzed single-family lease data for Texas and Bexar, Dallas, Harris, Tarrant, and Travis Counties.
Not all single-family rental properties were available for analysis. The data are restricted to single-family homes rented through Multiple Listing Services (MLSs) in 2011 and 2017. The sample data provide an interesting snapshot of this trending market niche.
Impact of Declining Affordability
A major cause of the reduction in affordability for potential homebuyers is the persistent lag in income growth compared with home price appreciation. The loss of affordability has also occurred during a period of historically low interest rates.
In 2011, 53 percent of Texas households could afford a median-priced home. The 30-year, fixed-rate mortgage rate that year averaged 4.68 percent, according to the Federal Housing Finance Agency (FHFA). By 2017, only 44 percent could afford a median-priced home. Meanwhile, the average mortgage rate had declined even further to 4.13 percent.
Affordability percentages were calculated using U.S. Census Bureau American Community Survey (ACS) and Real Estate Center data. These percentages assume an 80 percent loan-to-value (LTV) ratio, a 35 percent debt-to-income (DTI) ratio, and the average annual mortgage rate.
The calculations also include 3 percent of a home's value for property taxes, 1 percent for insurance, and 2 percent for utilities. The three components were added to principal and interest to arrive at a total monthly cost.
Single-Family Rental Growth Since the Great Recession
The national median home price dropped 23.7 percent from 2007 to 2011, according to the National Association of Realtors (NAR). Texas prices remained more stable during that period, which included the GR, with a slight overall increase of 1.1 percent.
By 2010, the U.S. mortgage delinquency rate had peaked at 8.9 percent while the national foreclosure rate reached 2.2 percent, according to the Federal Reserve Bank of New York and ATTOM Data Solutions. The national uptick in foreclosures during the GR provided investors with an opportunity to buy distressed homes for single-family rentals. The result reduced the supply of homes available to households for purchase.
Fortunately, Texas' mortgage delinquency and foreclosure rates were much lower than the nation's. Although still an important factor in the growth of Texas' single-family rental market, the conversion of single-family foreclosures into rentals has not contributed as much to that market's growth as in other states.
Another supply-side factor is the lack of new single-family construction. As in many other states, first-time and low-income buyers in Texas have difficulty finding new moderately priced homes. The result is even more pressure on single-family rentals.
Demand factors also played a role. With the passage of Dodd-Frank in 2010, the tightening of mortgage-lending standards reduced the number of households that qualify for homeownership. This led to an increase in the demand for all rental property, including single-family rentals.
Mortgage lenders primarily use three determinants to weigh the credit risk posed by a potential borrower:
- DTI ratio,
- LTV ratio, and
- Fair Isaac Corporation (FICO) credit score.
Of the three, FICO score requirements stiffened the most after the GR. The Urban Institute reported more than 30 percent of borrowers obtaining mortgage loans in 2001 had FICO scores below 660. The percentage remained fairly constant through 2006.
Beginning in 2007, the percentage of mortgages granted to homebuyers with FICO scores below 660 began to decline. By 2015, the percentage had decreased to approximately 14 percent. Although not all households with low credit scores are in lower-income brackets, the higher FICO score requirement is especially burdensome to potential homebuyers in that income segment.
Demographic factors, such as the millennial generation's desire for the added flexibility that renting provides, also dampened homeownership demand, according to the Harvard Joint Center for Housing Studies. Millennials' tendency to marry and start families later than past generations contributed to reduced demand as well.
Increasing Popularity
ACS data published by the U.S. Census Bureau show the number of single-family, owner-occupied homes increased by a mere 3.4 percent in the United States from 2009 to 2017. Texas fared better, increasing by 10.2 percent.
Alternatively, single-family rentals represent the fastest-growing sector of the housing market nationwide since the GR. During the same eight-year period, the number of single-family rentals increased by 14.6 percent in the United States and 18.9 percent in Texas. They now make up about one-third of all residential rental properties in both Texas and the U.S.
By 2017, approximately 20 percent of single-family homes in Texas were renter-occupied. Just over half of those (54.7 percent) were concentrated in the five counties surveyed for this study:
- Harris County (Houston area), 23.4 percent
- Bexar County (San Antonio area), 9.4 percent
- Tarrant County (Fort Worth area), 8.1 percent
- Travis County (Austin area), 7.7 percent
- Dallas County (Dallas area), 5.9 percent
What MLS Data Reveal
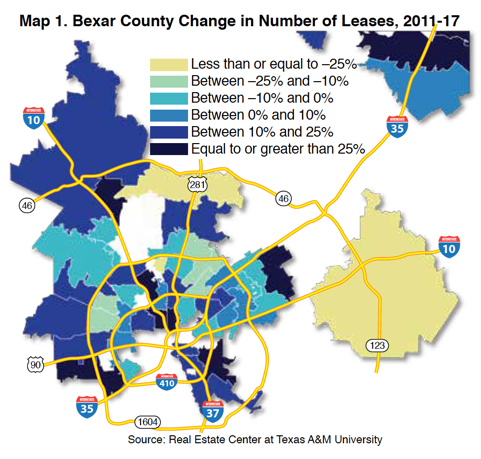
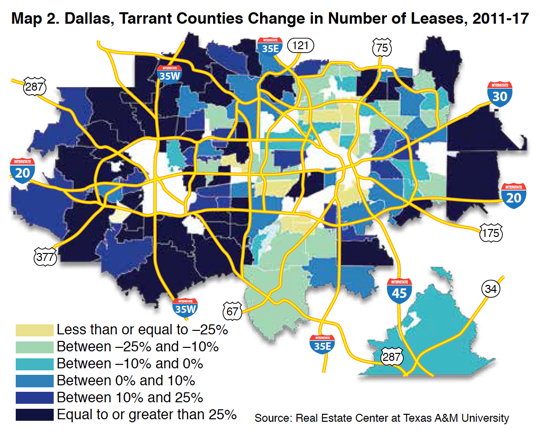
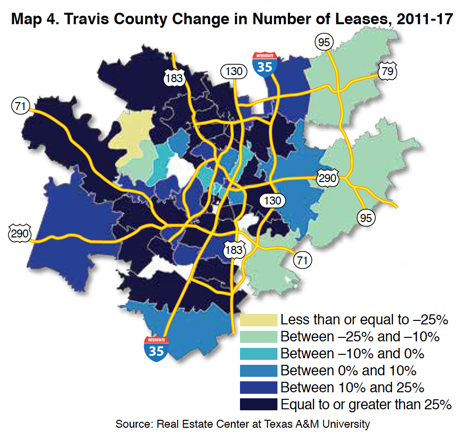
According to MLS sample data, the number of single-family leases increased from 2011 to 2017 in four of the five counties. Harris County had the largest increase (37.5 percent), while leases actually declined slightly (–2.4 percent) in Dallas County. Statewide, the increase was 34.5 percent (see table).


Within each of the five counties, the change in the number of single-family leases varied widely by ZIP code (Maps 1–4). No obvious pattern is visible within those ZIP codes. However, ZIP codes in Dallas and Bexar Counties had much lower rates of increase in the number of leases than did ZIP codes in Tarrant, Travis, and Harris Counties.

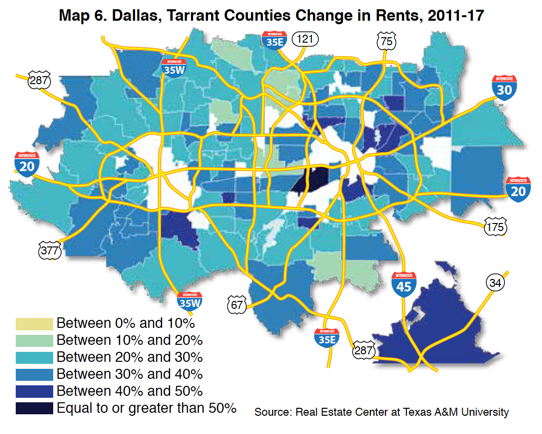
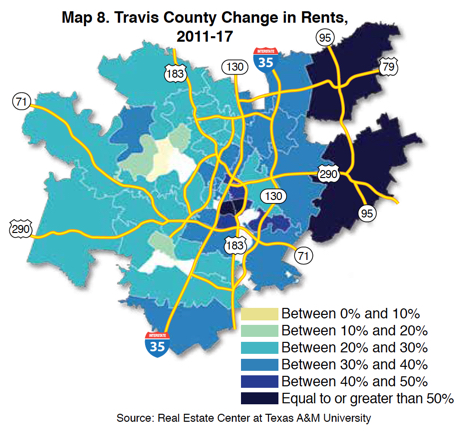
Percent changes in rental rates from 2011 to 2017 for the five counties are shown in Maps 5–8. No statistical relationship was found between changes in the number of leases and changes in rental rates. Median rent per square foot, as opposed to the median rent, was used to control for changes in the size of the rental.
During the six-year span, single-family rents increased countywide across all studied counties. Despite its more moderate increase in the number of single-family leases, Dallas County witnessed the highest countywide uptick in rents (31.9 percent, or approximately 4.6 percent per year) of the counties.
Statewide, the rental rate increase averaged 23.9 percent, translating into an average annual growth rate of 3.4 percent. Similar to the change in number of leases, the change in rents varies widely across each county.


Rising Rents Hurt Affordability
From 2011 to 2017, median household income in Texas increased by 19.9 percent, an average of 2.8 percent per year based on ACS data. With the exception of Travis County, rent growth exceeded income growth statewide and across all five counties analyzed (see table).
When rent growth outpaces income growth, households are forced to spend a higher percentage of their income on rent, reducing affordability. Lower-income households are most adversely affected by the decline in affordability. Their lower disposable income means any increase in rent has a more dramatic impact on money remaining for basics such as food, transportation, and utilities.
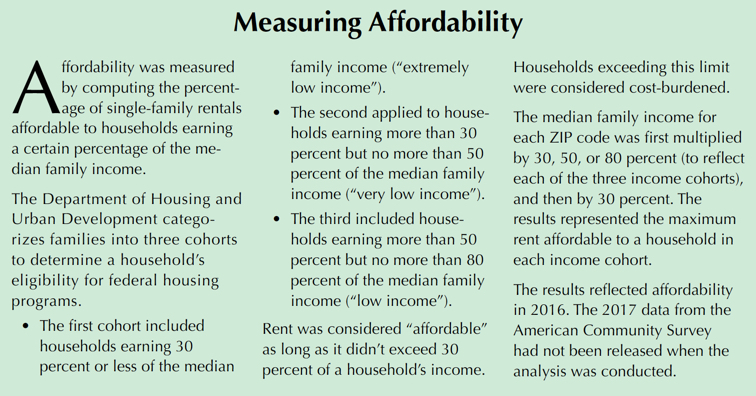
With one exception (77401, Harris County), no ZIP code across all five counties is affordable to “extremely low-income" or “very low-income" households (Maps 9–12). The majority (58.6 percent) are not affordable even to those households in the “low-income" bracket. For a description of each bracket, see “Measuring Affordability" sidebar.

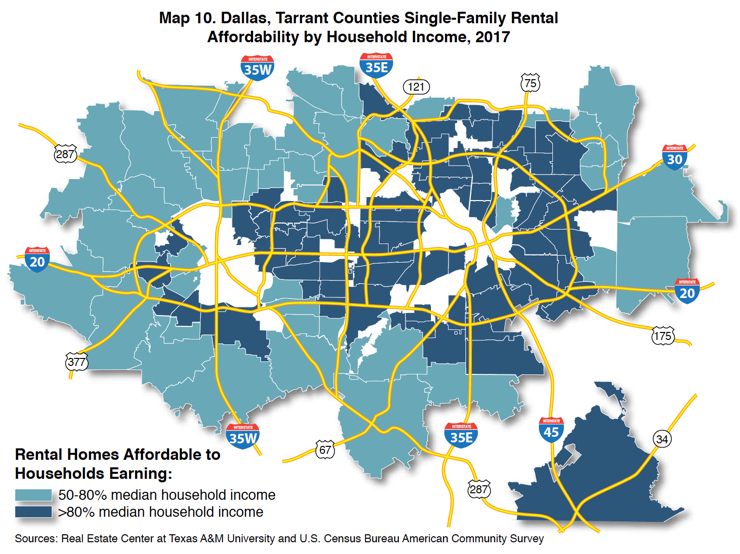
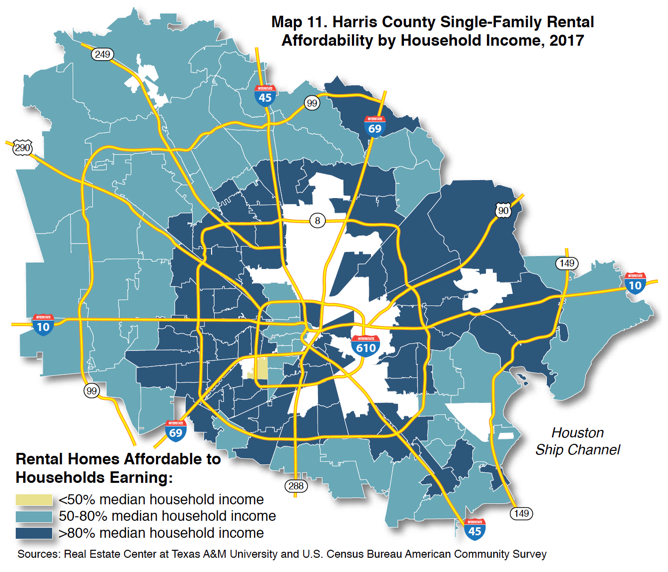


Single-family rentals in ZIP codes closer to the center of each county's downtown are less affordable. Among the 338 ZIP codes mapped, only 77401 was affordable to households earning 50 percent or less of the median family income.
Moving away from downtown, affordability improves. This trend is consistent across all five counties. Of the counties analyzed, Tarrant had the highest number of ZIP codes affordable to “low-income" households.
Based on available MLS data, single-family rentals are not an affordable option for lower-income households near the urban core. Housing affordability improves significantly for those willing to move farther out from central cities. However, transportation-related costs become an issue. As a result, many of these households will continue to depend on other forms of rentals—such as apartments or manufactured housing—to meet their housing needs.
What Does the Future Hold?
Institutional investors were the first to dive into the single-family rental market, reaping strong returns from the purchase of distressed homes after the GR. Smaller investors followed their lead. However, recent rapid price increases in single-family housing means purchases of single-family homes by investors may not be as prevalent going forward.
At some point, investors may choose to sell their inventory of single-family rentals. If this happens, it could provide some relief to lower-income households by reducing the competition for more affordable single-family homes.
_______________
Dr. Hunt (hhunt@tamu.edu) is a research economist and Losey a research intern with the Real Estate Center at Texas A&M University.